|
There are a number of influences in the market that will be pushing the direction prices move, and everyone has their opinion on where the market is going. Expert opinion seems to vary when it comes to predicting the future of the 2022 real estate market. The only point they all agree on is that there will be movement on price over the next 12 months.
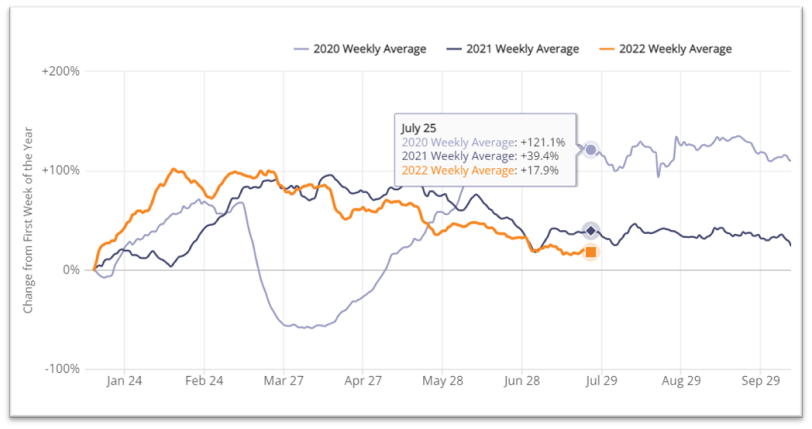
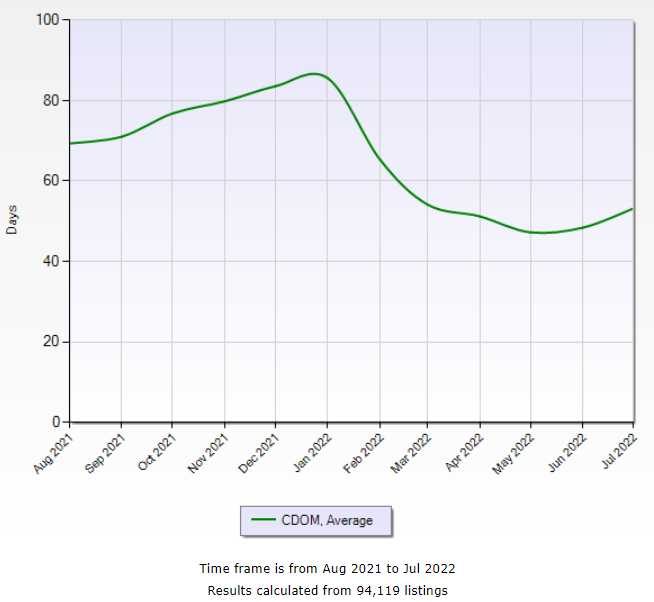
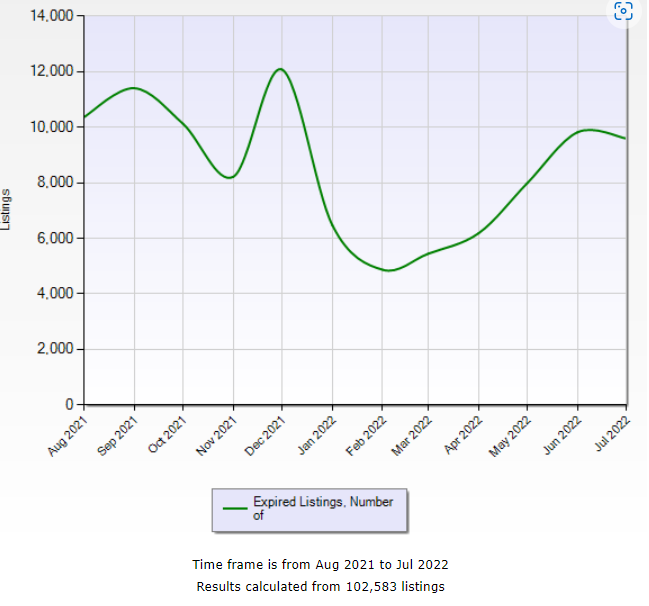
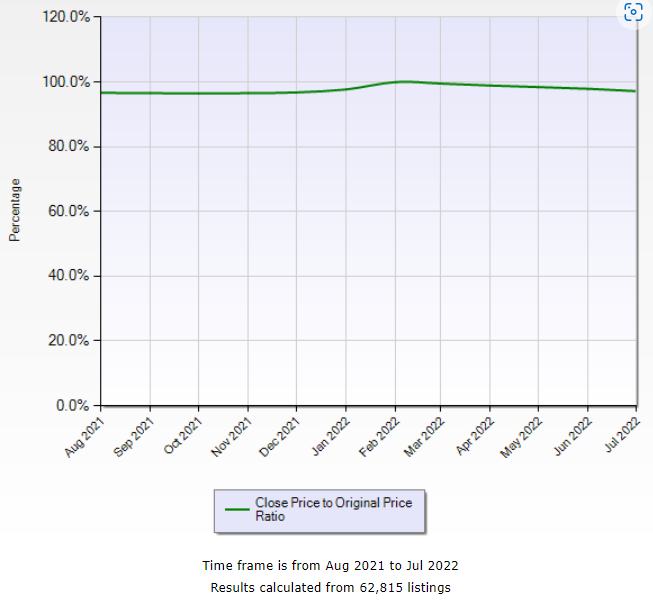
To price a home, we can analyze the market and take cues from these indicators to determine the most current local market trend. To get a home sold quickly for the best possible price it is important that we do not get behind the market. We don’t want to price it too low in an upward trending market or too high in a downward trend. As part of a Comparative Market Analysis where we look at past sales and current listings, the direction the market is currently trending informs on how a home should be priced. Let’s look at what current data is showing us as of today July 26, 2022. To price a property well, we don’t have to make wild predictions about where the market is going 6 months from now; we just have to know where the market is right now and where it is trending to help us determine a pricing strategy. Here are those 5 market indicators that can give us an understanding of the current state of the market. 1. Showing Activity As you can see from the chart below, showing activity in Alberta was trending down and appears to have leveled off, at least for the short term. 2. Days On Market The average days on market in the Greater Calgary Area has started to increase slightly. Based on the chart, This trend began in mid June after a hot market that initiated a downward trend in the number of days on market starting in January of this year. 3. Number of Multiple Offers Although this is something that is not tracked or charted, I have my own experience and anecdotal evidence from my fellow agents that the number of multiple offers has started to decline. There are still many properties being sold in multiple offer situations. At one time, earlier in the year, this was the norm. That is not the case at this moment in time. 4. Number of Expired Listings When prices are trending up or down, it becomes more difficult for agent to establish value when listing a property. We have seen several months of upward trending prices and as the market shifts, expectations for a higher priced sale may remain beyond the point of the shift. The number of expired listings in the Calgary Area does not seem to be showing a significant trend, but seems to have leveled off and even show a slight decrease in July. This would indicate we may see a slow down in the upward trend of pricing, but there is currently no definitive indicator that would lead us to believe prices are currently trending down. 5. Number of Price Reductions The number of listed homes making price reductions is another indication of a pricing trend. In this chart we are looking at the selling price compared to the original listed price. As you can see by this chart, there does not seem to be a significant trend coming into play at this point in time. Sellers are holding firm on their prices Where does that Leave Us? What can we say about the current state of the market? The number of showings are down from their peak in March. Days on market are going up slightly and the number of multiple offers has decreased, but they are still happening with desirable properties. The number of expired listings is reasonably unchanged but could be hinting at an upward trend and the selling price to listing price ratio seems to have normalized. The data from these 5 indicators seems to be showing us the market has no definite trend, but we seem to be at a turning point from rapid price escalation. We are coming out of a steep upward trend with all indicators leveling off.
Where we go from here depends on certain influencing factors.
0 Comments
|
AuthorJim Perks is a Calgary REALTOR who divides his time working with both sellers of houses and buyers of homes. He has been an agent since 2010 Archives
September 2023
Categories
All
|


 RSS Feed